Introduction
Stanislav Chuvashov proposed a Forex trading technique using the “Chuvashov’s Fork” pattern. In this technique, the approach to market analysis has something in common with DeMark’s approach to drawing trend lines for the last closest time interval.
1. A Method for Drawing “Chuvashov’s Fork” Pattern Lines
The fractals indicator is used to draw the “Chuvashov’s Fork” pattern. The main trend line is drawn passing through the two neighboring fractals 1 and 2 as shown in the price chart (see Figure below). The main uptrend line is drawn based on lower fractals; the main downtrend line is drawn based on upper fractals.
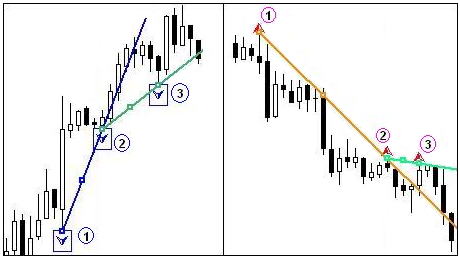
Figure 1. Drawing the “Chuvashov’s Fork” pattern
We should wait until a similar fractal 3 gets formed following the main trend line breakout in the opposite direction to the trend. A lateral line drawn through fractals 2 and 3 together with the main trend line forms the “Chuvashov’s Fork” (CF) pattern. This is the name given by the author Stanislav Chuvashov.
The main requirement to the CF pattern is that the lateral line of the fork must be in the direction of the trend. Lateral lines breaking through give rise to signals: to sell in the uptrend and to buy in the downtrend.
Below is the sequence of formation of the “Chuvashov’s Fork” pattern as exemplified on EURUSD H1 over 4 consecutive days.
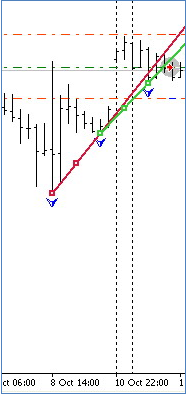
Figure 2. “Chuvashov’s Fork” pattern formation
Figure 2 shows the emergence of the “Chuvashov’s Fork” (CF) pattern on the uptrend suggesting the end of the trend or that the trend is going flat.
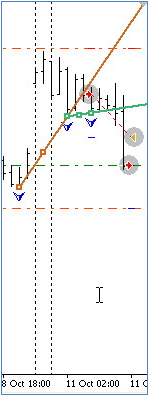
Figure 3. New CF pattern
6 bars (hours) later, a new CF pattern with a wider gap emerged (Fig. 3) confirming the previous pattern that suggested the reversal of the trend or it going flat.
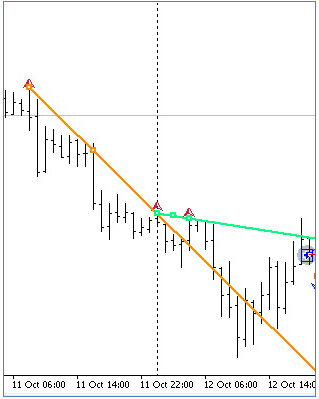
Figure 4. CF pattern confirmation
Fig. 4 shows that after the trend reversal on October 11, the trend was going down which is confirmed at the beginning of October 12 by the CF pattern directed downwards.
In the middle of the day, a new trend reversal started to take shape as the price moved towards the lateral CF line. After the lateral line is crossed, the existing SELL position can be closed and a BUY position can be opened.
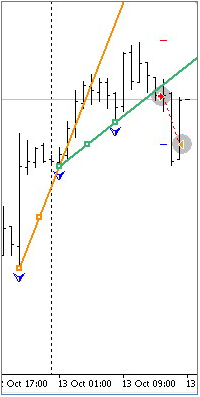
Figure 5. Trend reversal
As can be seen in Fig. 5, the trend kept going up for the remaining part of the day on October 12 and the beginning of October 13. Towards the middle of the day, an upward CF pattern has emerged. Another trend reversal began to show in the middle of the day on October 13.
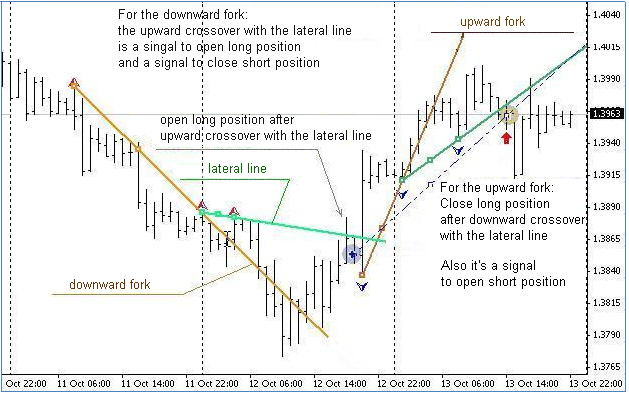
Figure 6. Trading signals
Figure 6 provides some clarifications in terms of signals for opening and closing positions.
Conclusion
The described technique can be used by traders as a trading system component. However it needs to be further developed in terms of filters for opening positions.


